> ## Documentation Index
> Fetch the complete documentation index at: https://docs.sabaothcloud.com/llms.txt
> Use this file to discover all available pages before exploring further.
# Logs
> Read PostgreSQL logs for a service
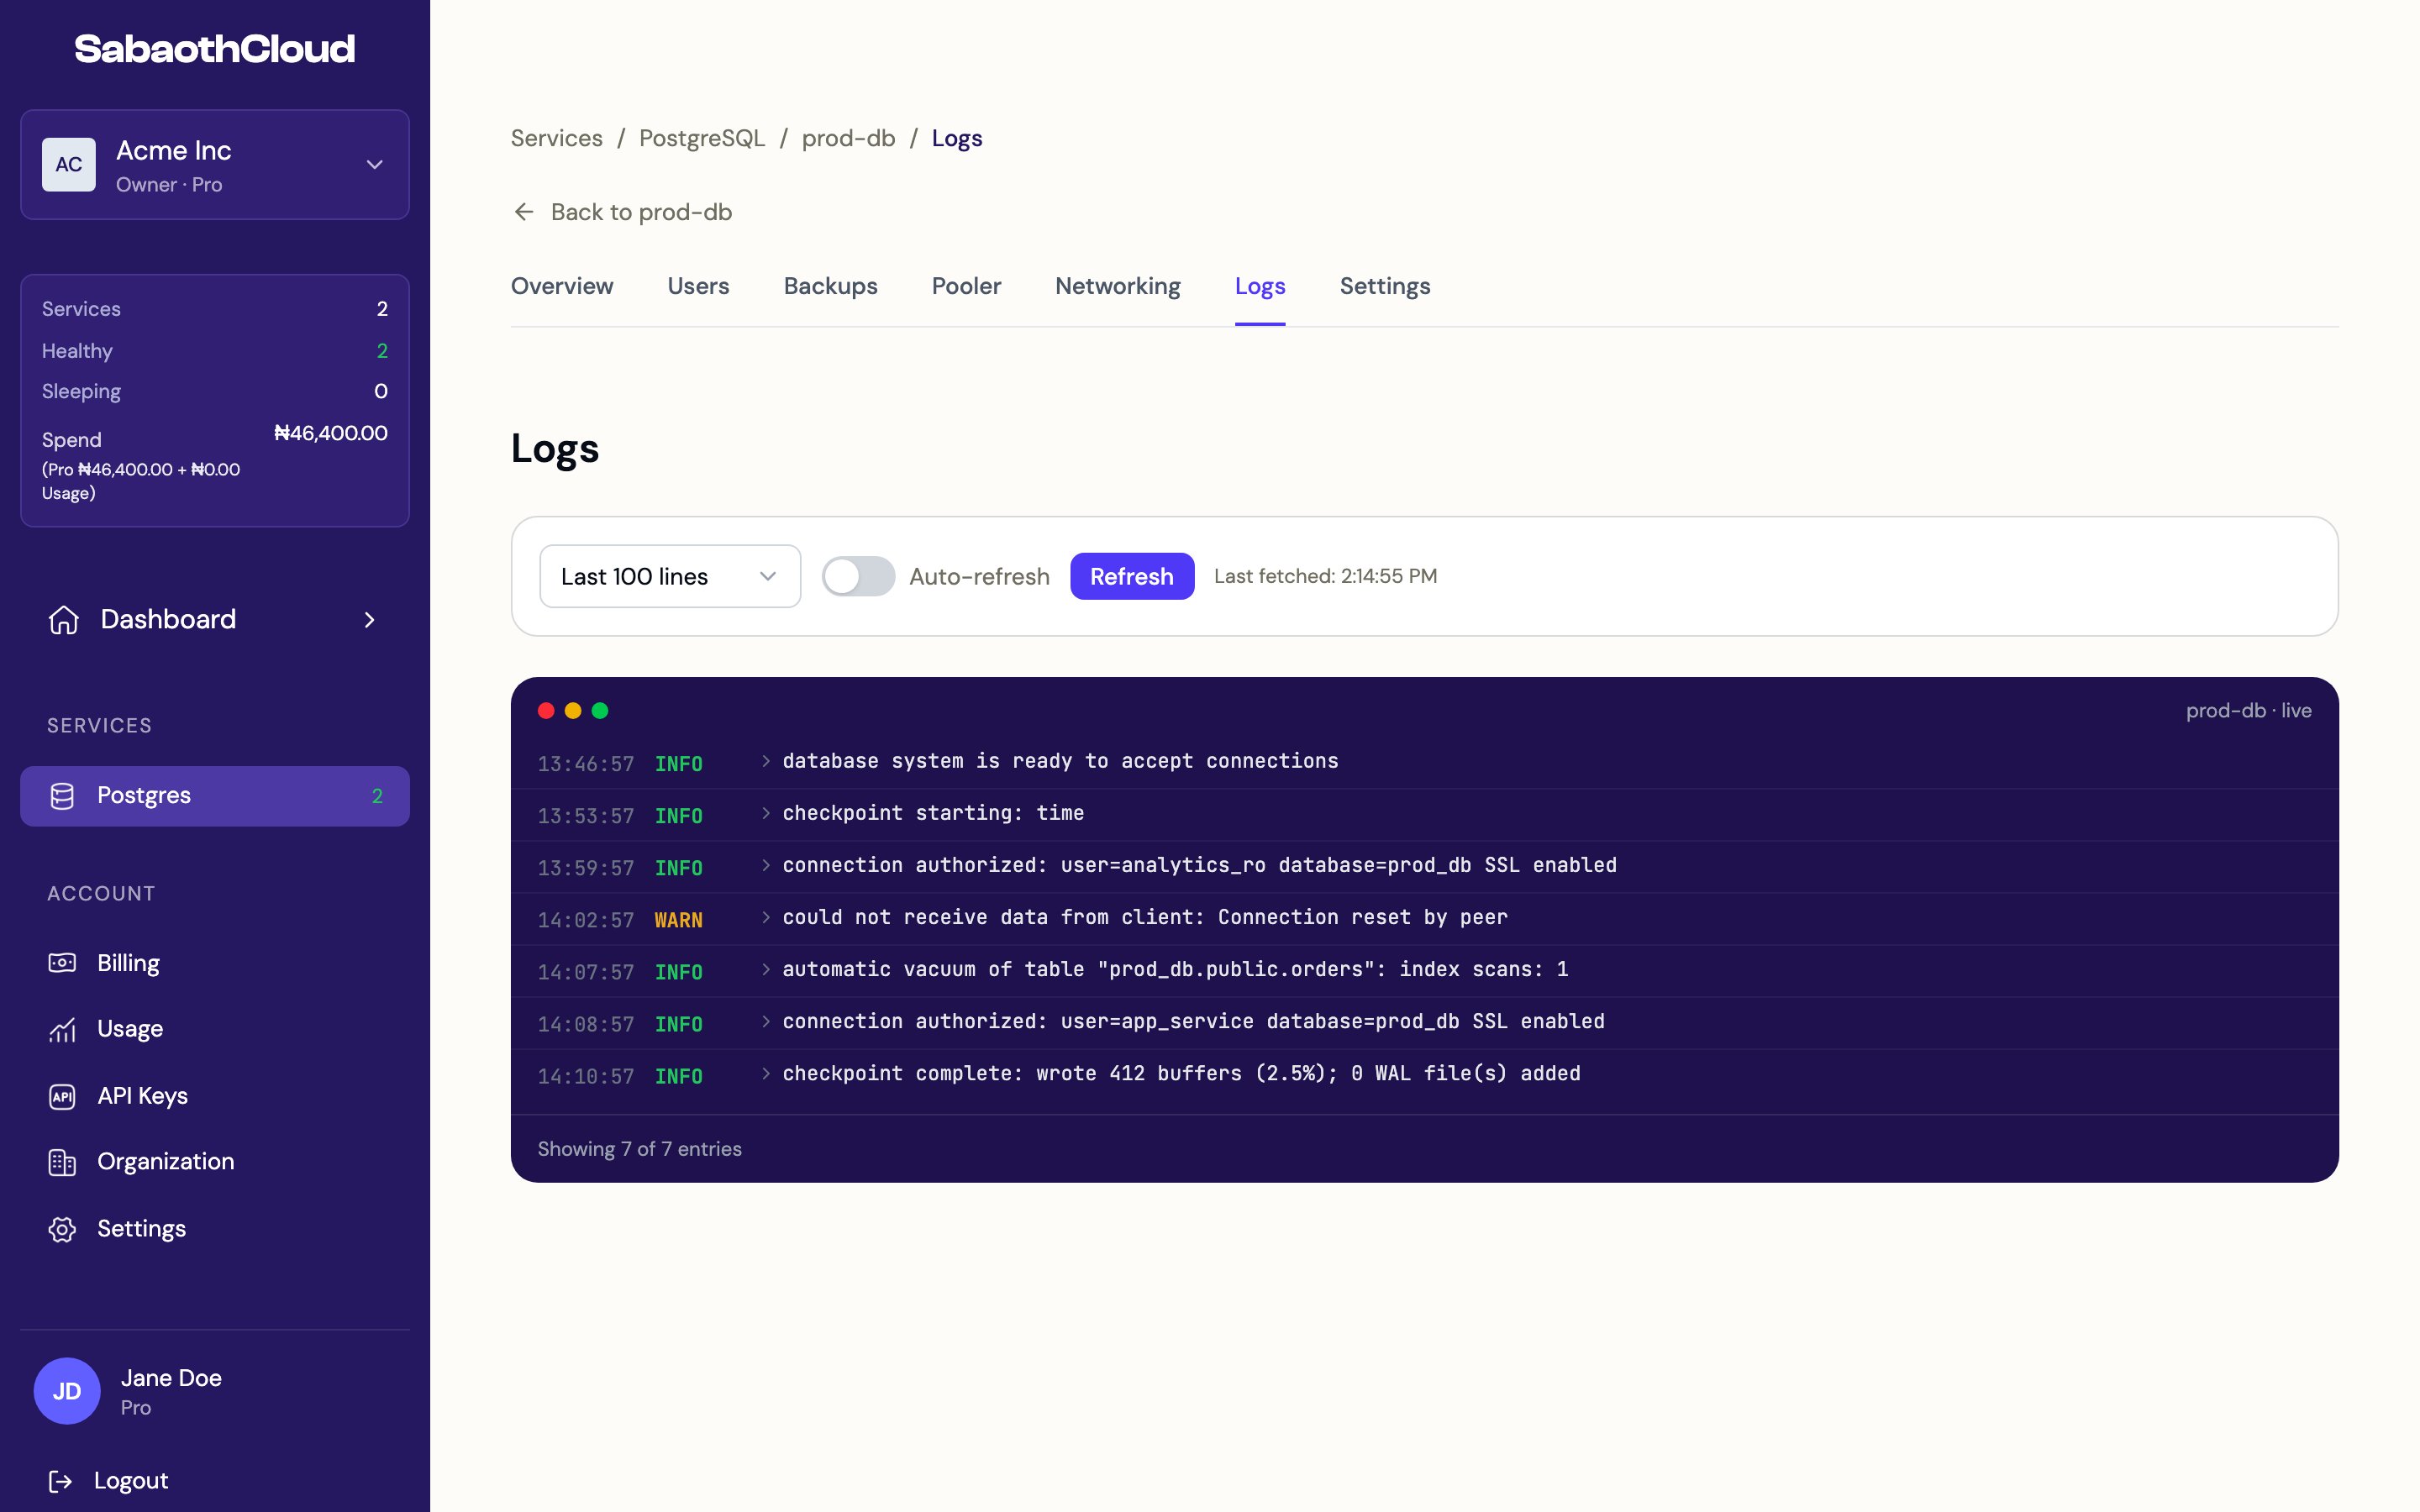
Open a service and go to the **Logs** tab to see its PostgreSQL logs.
 ## Reading logs
Each entry shows the time, the level and the message. Warnings and errors are highlighted. Click an entry to expand it and see its details.
Routine health-check entries are hidden so the entries that matter are easier to find. Click **Show health checks** in the log view to include them.
## Controls
| Control | What it does |
| - | - |
| **Lines** | How many recent lines to load: 100, 500, 1000 or 5000. |
| **Auto-refresh** | Loads new entries automatically while the page is open. |
| **Refresh** | Loads the latest entries now. |
The time of the last update is shown next to the controls.
## Recent logs on the overview
The service's **Overview** tab shows the most recent entries in **Recent Logs**. Click **View all logs** to open this page.
Logs appear once a service has started. A service that is still **Provisioning** may not have any logs yet.
## Related
* [Audit logs](/dashboard/audit-logs) record who did what in your organization, such as creating services or accessing credentials.
* [Usage](/dashboard/usage) shows resource usage against your plan.
This documentation is built and hosted on [Mintlify](https://mintlify.com), a developer documentation platform.
## Reading logs
Each entry shows the time, the level and the message. Warnings and errors are highlighted. Click an entry to expand it and see its details.
Routine health-check entries are hidden so the entries that matter are easier to find. Click **Show health checks** in the log view to include them.
## Controls
| Control | What it does |
| - | - |
| **Lines** | How many recent lines to load: 100, 500, 1000 or 5000. |
| **Auto-refresh** | Loads new entries automatically while the page is open. |
| **Refresh** | Loads the latest entries now. |
The time of the last update is shown next to the controls.
## Recent logs on the overview
The service's **Overview** tab shows the most recent entries in **Recent Logs**. Click **View all logs** to open this page.
Logs appear once a service has started. A service that is still **Provisioning** may not have any logs yet.
## Related
* [Audit logs](/dashboard/audit-logs) record who did what in your organization, such as creating services or accessing credentials.
* [Usage](/dashboard/usage) shows resource usage against your plan.
This documentation is built and hosted on [Mintlify](https://mintlify.com), a developer documentation platform.